A few days ago, a friend of mine was quite excited about Serba Dinamik Holdings Berhad (“SERBADK”) and asked me to look. And having missed out on a few palm oil companies (despite doing research together, I might add. I am this untalented at trading. Thankfully, I held on and topped up my SOP at the bottom), I figured I better take a look.
Serba Dinamik was a company that I kept my eye on for some time. And I quite liked their annual report management explanations, as it seemed relatively clear by Malaysian standards, however, I never really did any analysis before.
The management spoke a lot about very nice sounding things and buzzwords such as, “Smart Maintenance Contracts”, “Project Development”, “IT Projects” etc, and even had a nice 7 part episode on the company on Astro Awani.
However, to be honest, it sounded a bit like the typical things that any CEO in the world would say, I mean, how long has it been since Tan Sri Shahril talked about SAPRNG making a profit?
And just after an RM8bil fund injection into it by PNB to save Maybank (they held a big chunk of SAPRNGS loan book), its now looking like it might still go down at any day again, with Current Liabilities again exceeding Current Assets.
And taking a quick look at the numbers of SERBADK, they sure raise some eyebrows.
Owners Earnings
Now the tool that we are going to use in our analysis is called “Owners Earnings”. It is a valuation method detailed by Warren Buffet in Berkshire Hathaways 1986 annual report. Warren Buffet stated that the value of a company is simply the total of the net cash flows (owner earnings) expected to occur over the life of the business, minus any reinvestment of earnings.
It is defined by him as such,
“These represent (a) reported earnings plus (b) depreciation, depletion, amortization, and certain other non-cash charges, less (c) the average annual amount of capitalized expenditures for plant and equipment, etc. that the business requires to fully maintain its long-term competitive position and its unit volume.
Our owner-earnings equation does not yield the deceptively precise figures provided by GAAP, since (c) must be a guess – and one sometimes very difficult to make. Despite this problem, we consider the owner earnings figure, not the GAAP figure, to be the relevant item for valuation purposes.
All of this points up the absurdity of the ‘cash flow’ numbers that are often set forth in Wall Street reports. These numbers routinely include (a) plus (b) – but do not subtract (c).”
In essence, it means,
Owners Earnings =
(a) Reported Earnings
Add: (b) Depreciation and Amortization
Add/Less: (c) Other Non Cash Items
Less: (d) Average Annual Maintenance Capex
Add/Less: (e) Changes in Working capital.
For the sake of simplicity, we are going to use “Total Comprehensive Income” for “Reported Earnings” and “Capital Expenditure & Acquisitions of Companies” as “Average Annual Maintenance Capital Expenditure”.
For the second, the main reason we use the total expenditure instead of calculating the average annual maintenance capex is due to how difficult it is to get a meaningful number for “Maintenance Capex”.
In addition, the amount they spend on capital expenditures is not the main point, as in terms of accounting profit, they very clearly seem to be putting all that Capex to good use.
Now why owner’s earnings?
Because the P/L can show whatever numbers they want, but at the end of the day, the number that really matters is how much of it goes back into the owner’s pockets, as we have very clearly seen with London Biscuits recent PN17 status.
So, what does it look like for SERBADK?
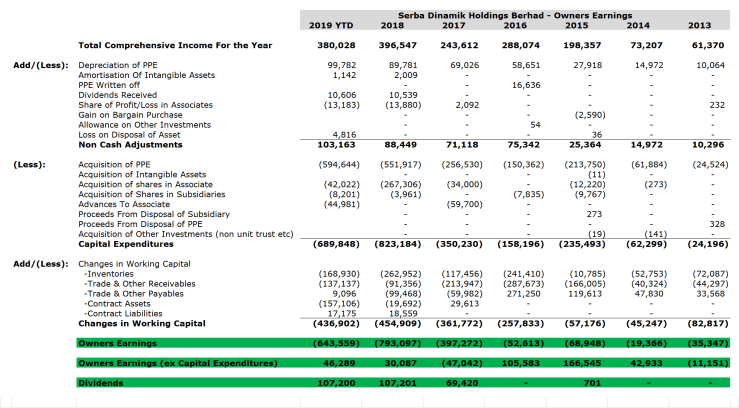
As you can see, its quite incredible how since 2013 this Company have recorded huge negative Owners Earnings.
Having said that, if we were to exclude Capital Expenditures, on a net basis RM333.2 million in cash have been generated, out of which, dividends totaling RM284.5 million have been paid out since 2014, with the bulk of it being made post IPO.
Having said that the cash generated (on a owners earnings basis) is a far cry from the profit reported, and this is from the incredible increase in working capital requirements each year.
When compared against their Revenue and Comprehensive Income,
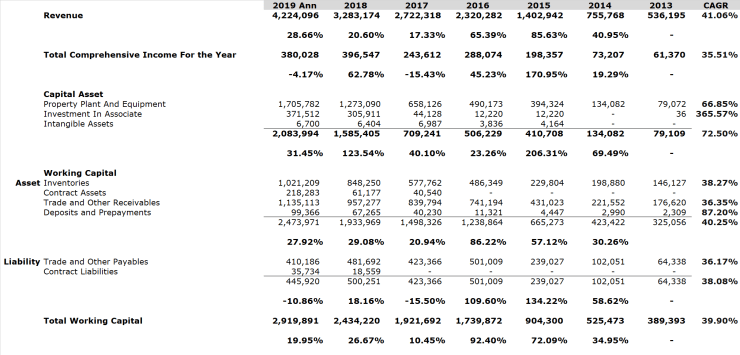
Its interesting to note, that the growth in Capital Assets, far exceed that of the growth in Income and Revenue. And considering that these assets are the kind that relies on new projects (which can be very lumpy and irregular) in order to be utilized, It does not seem to bode well.
Look at Sapura Energy etc.
In addition, the increase in Working Capital on the Asset end of the balance sheet have far exceeded the growth in revenue. However, on the liability end, we are looking at a strong drop in working capital.
This indicates that the credit period they obtained from creditors seem to be shortening, while the credit they give to debtors seem to be holding steady or increase.
Easy to pay money to creditors, but collecting money seems to take quite a bit longer. Which is interesting.
Conclusion
I may very well be extremely wrong, and this may very well just be initial capex cost in their path of world domination, however I digress. If you were to do an owners earnings analysis of SAPRNG from 2008 to 2019, it looks quite similar.
I hope I’m wrong, as i have no skin in game, it matters not to me if i’m right.
As usual, feel free to let me know if you think differently or if you feel I’m wrong.

2 thoughts on “Something is weird in the State of Serba Dinamik Holdings Berhad (SERBADK: 5279)”