
Introduction
Well, given the fall in prices for Malaysian Banks recently (much of it due to the two recent rate cuts, expected additional cuts in the future, and foreign fund outflows), i decided to embark on a surface level study of the numbers for all the banks in Malaysia, and to benchmark them against those of the Big 3 in Singapore.
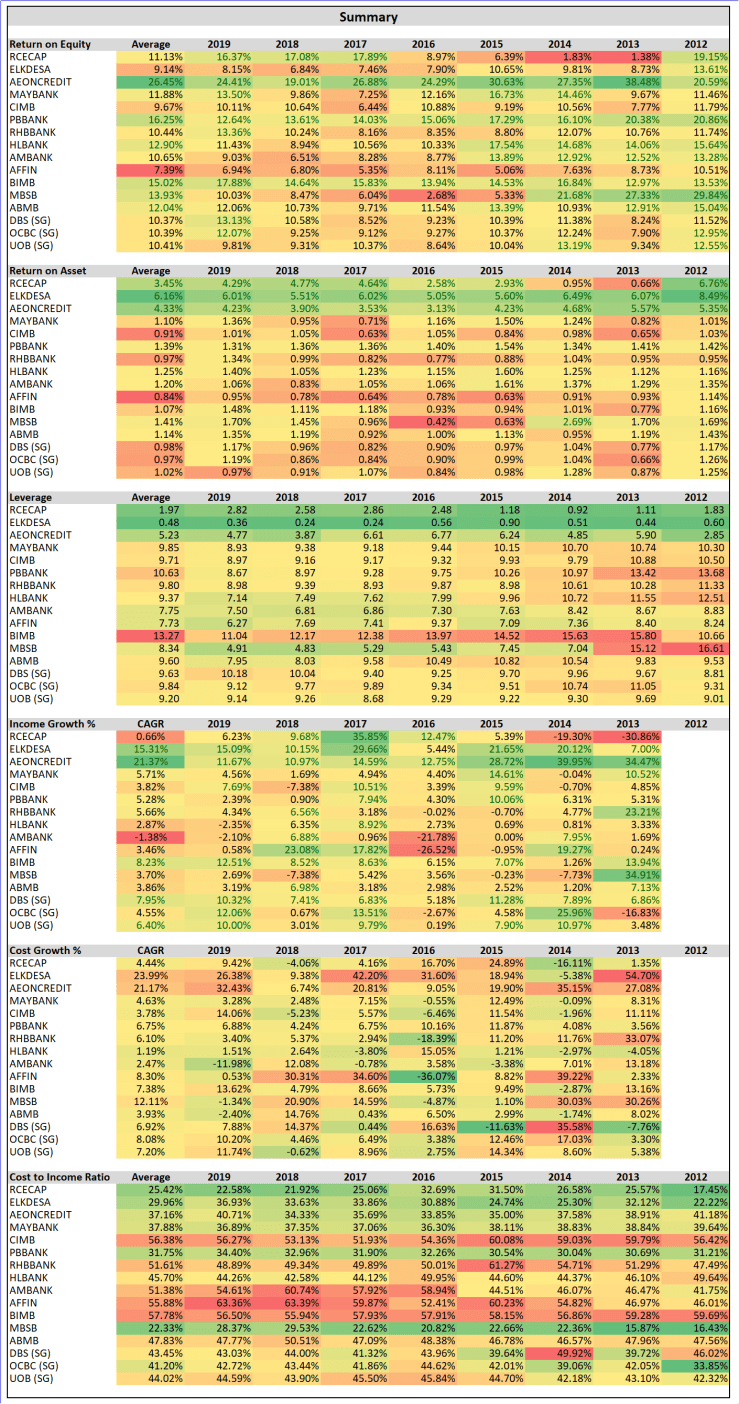
As usual, our Malaysian champion Public Bank hits it out of the park when it comes to Cost to Income Ratio (calculated by dividing the operating expenses by the operating income generated i.e.net interest income, net insurance income plus the other income).
However, that is not the be all end all as you will read in my comments below, Public Bank is currently facing serious challenges.
And as usual, Malaysian Banks and Stocks, are valued much higher when compared against Singapore or South East Asia, mainly due to wanton buying by our sovereign funds.
The Risk Free Rate/ FD Rate in Singapore is 1.6%, while in Malaysia it is at least 3.3% – 3.9% in Malaysia. (Ps, for the highest FD rates, go to MBSB, they actually gave me 4.25% before the rat cut).
Despite this DBS, a very well managed bank is only valued at PE10, which in Malaysia, until recently, most banks sold for far higher than that.
In any event, it was fun doing it, let me know what you guys think.
Summary
Individual Banks
Alliance Bank Malaysia Bhd
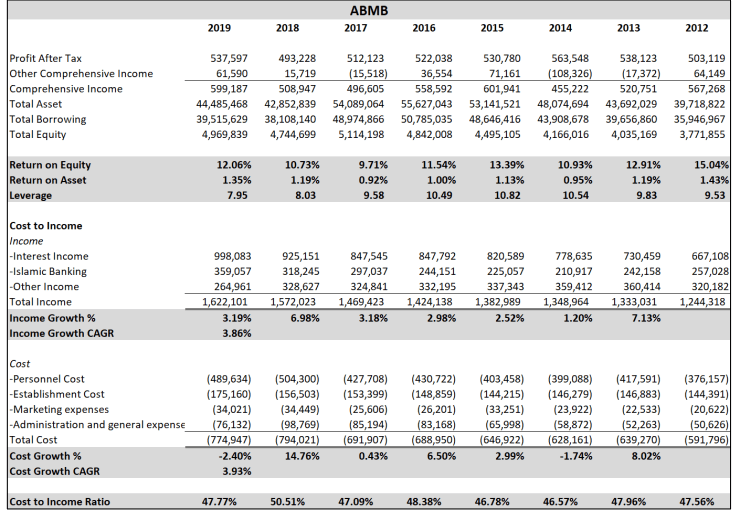
From here, we can see historically, performance of the bank is fairly decent. Cost to Income is largely maintained, which is really good. Profit is maintained despite ongoing deleveraging, mainly from better loan books.
Given the balance of probabilities, i would think the London Biscuit fiasco is a outlier. At the current price of something around 6PE normalized earnings, seems cheap..
In addition, according to an insider in Alliance Bank, they have tightened their credit underwriting across the board since the recent credit loss, which is good for the long term, but also a headwind to loan growth (which i have no problem with).
AEON Credit Service (M) Berhad
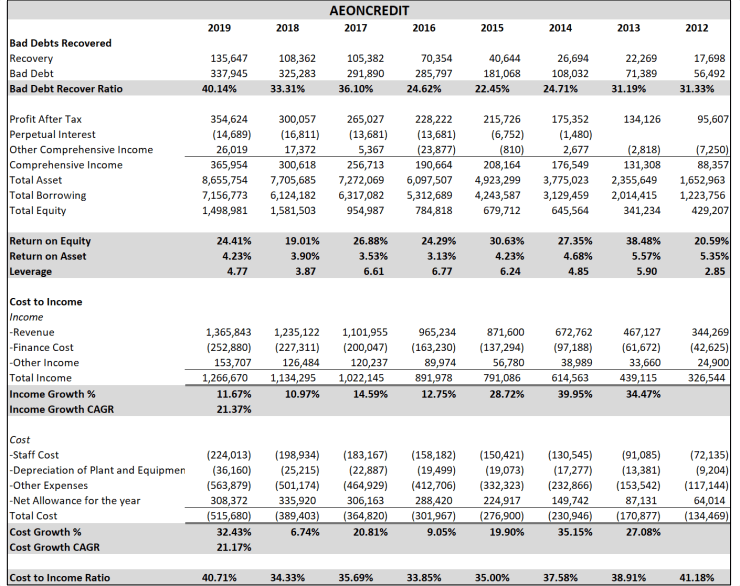
One of the best performer in this bunch, if not the best. Cost to Income for 2019 shot up from new marketing initiatives to better bundle their products.
Seem particularly attractive as given that the recent fall in share prices from adoption of MFRS 9, which had zero impact on the economics of the business.
Affin Bank Berhad
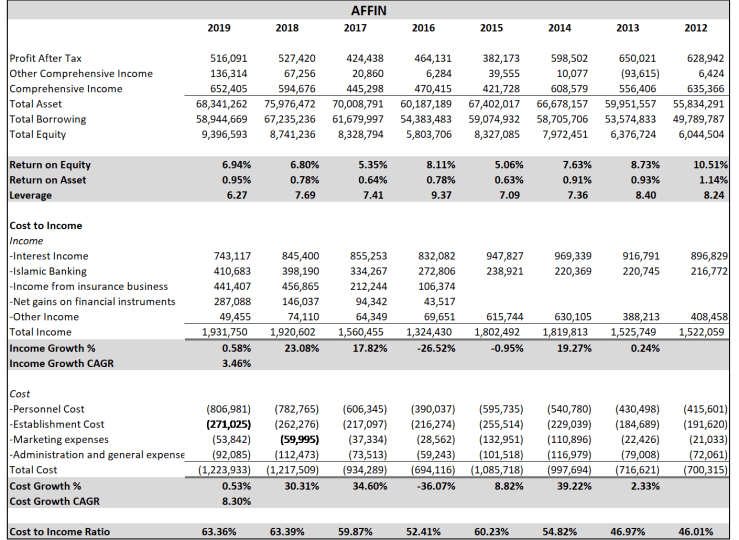
Just a shit bank, by far the worst in this group.
If you didn’t know this from them building a new HQ worth 15% of their market cap, and more than 1 year’s earnings.
The numbers just proved it.
AMMB Holdings Berhad
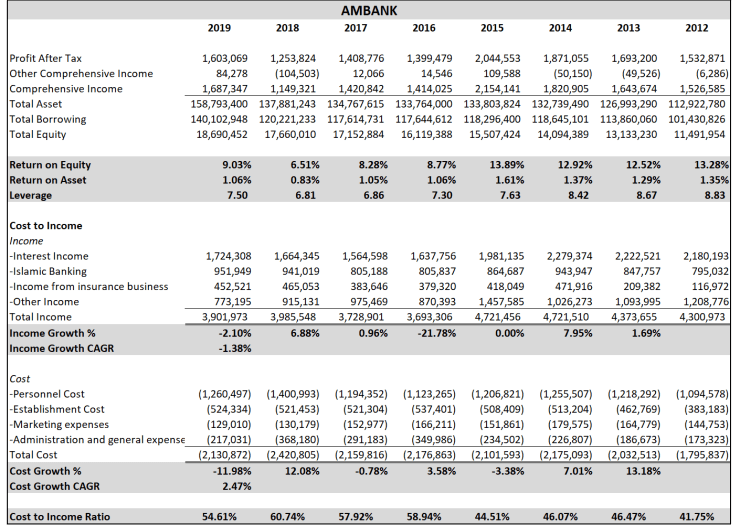
Well, they definitely got beaten down after the 1MDB scandal erupted. Cost to Income ratio is way up. Their little brother RCECAP is doing more than fine though
Bank Islam Malaysia Berhad
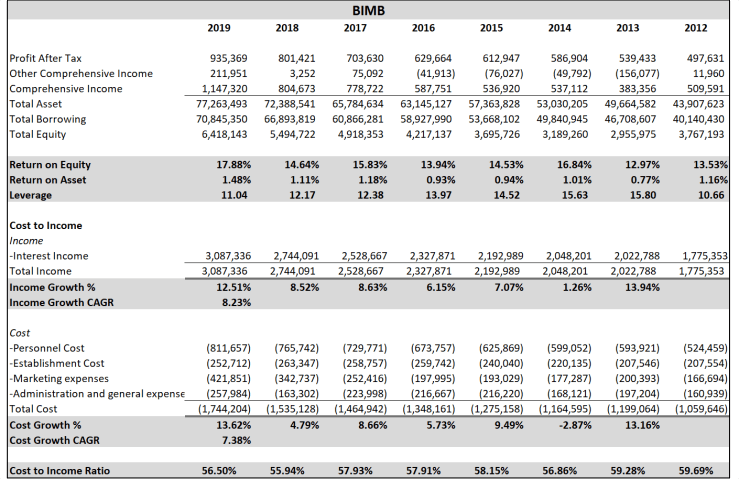
Highest leveraged bank in Malaysia. They’ve been trying to reduce this by doing dividend reinvestment schemes. What i find quite interesting, is that their loan book seems fairly good (based off ROA).
Considering this is owned by Tabung Haji, i can’t imagine the management being world beaters, as evidenced by their high Cost to Income Ratio.
My guess is that there must be something in the name Islam, that makes people feel like they definitely have to pay back their debts.
Also most GLC’s tend to just buy insurance from Takaful. So there’s that.
CIMB Group Holdings Bhd
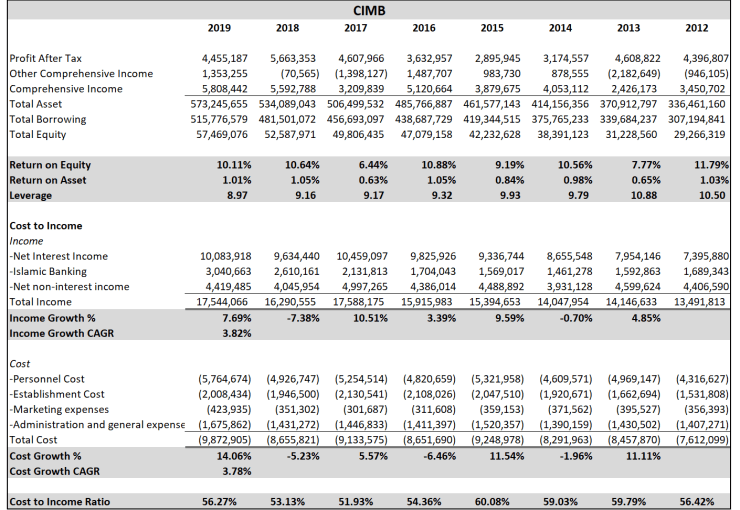
Cost to income ratio seem bad, especially given their size. Reading the annual reports and seeing the numbers, i’m not inspired.
ELK-Desa Resources Berhad
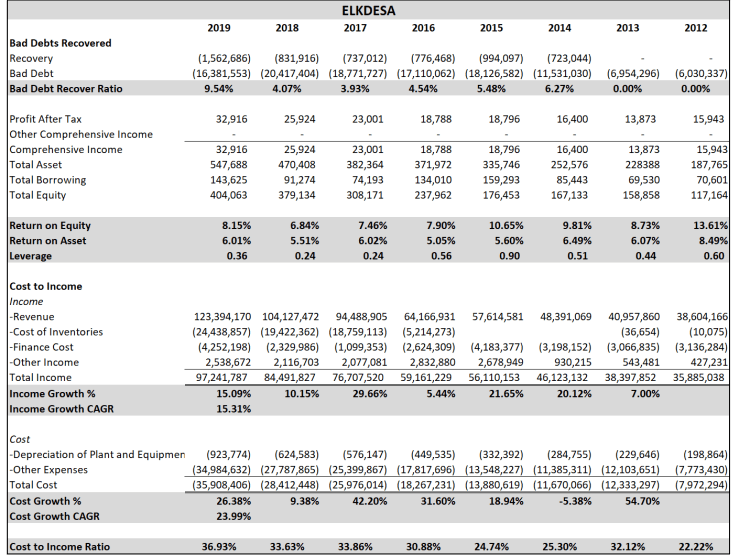
One thing to note, this is not exactly a financial institution, as furniture consist of a relatively large portion of the revenue and cost. So i actually may not make much sense to analyse it this way.
Seems like a weird combination, would prefer them to be separate.
Hong Leong Bank Berhad

Loan book quality is great, as evidenced by their ROA, lowest leveraged bank (not counting MBSB which only just became a bank). Very interesting.
Malayan Banking Berhad
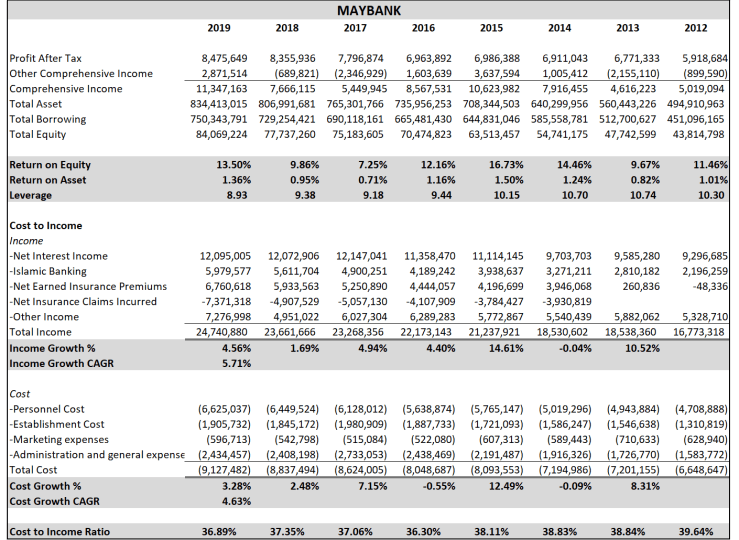
Malaysia Daikor, given the economy of scale, its no surprise they managed to keep/reduce the Cost to Income ratio.
Insurance division growing, but also making less money. Seems ok, but not inspiring.
Malaysia Building Society Berhad
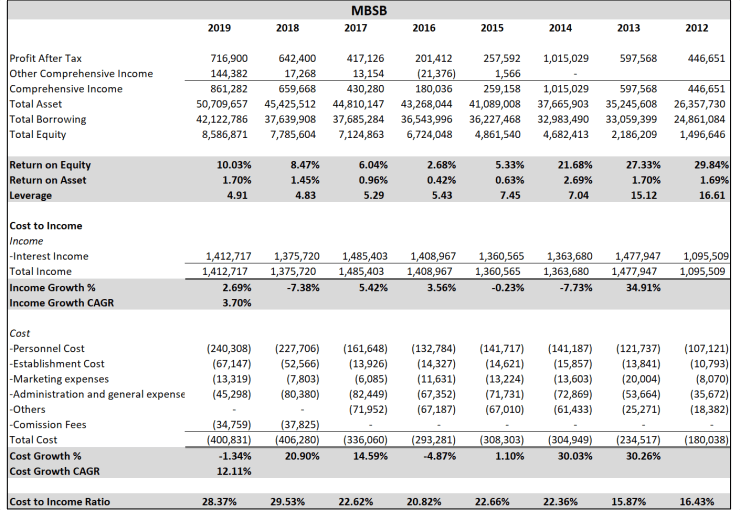
Lowest cost to income ratio among all the deposit taking banks. Talk about a surprising result.
I think its mostly from the fact they only just turned into a bank, and quite frankly do not have the same reach as most banks. Which may actually be a good thing.
Still, i would not actually believe their Loan Book quality yet, as the high ROA’s in recent year is due to write backs from heavy kitchen sinking in 2016 and 2015.
Public Bank Berhad
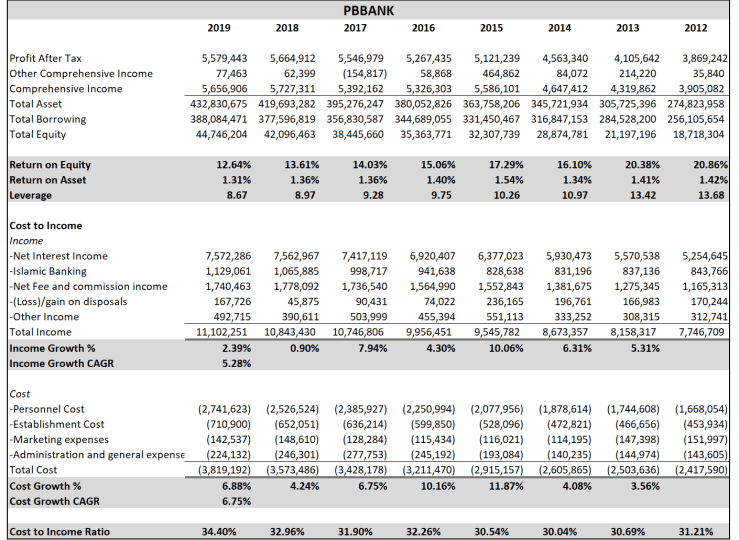
Other than MBSB (which i consider an anomaly), Public Bank has the lowest cost to income ratio. No surprises here. But in recent years, this ratio have crept up. This is mainly due to their loan books being primarily housing, which is in the doldrums, resulting in lower revenue growth. Growth in cost however, did not.
Historically, Public Bank have avoided Corporate Banking (except to chinaman companies who don’t need the money), which is one of the reasons their profit’s are so great.
However, in days when housing/property loan market is drying up, this is biting them in the ass. I have no idea what PBBANK should do, as i would rather avoid corporate banking, other than to really expand into Cambodia and Vietnam.
Now, one would think that its worth it at the current price, but as you can see later when bench-marked against Singapore.
Malaysian banks and stocks are usually overvalued. You can buy DBS for 20% cheaper valuation wise.
RCE Capital Berhad
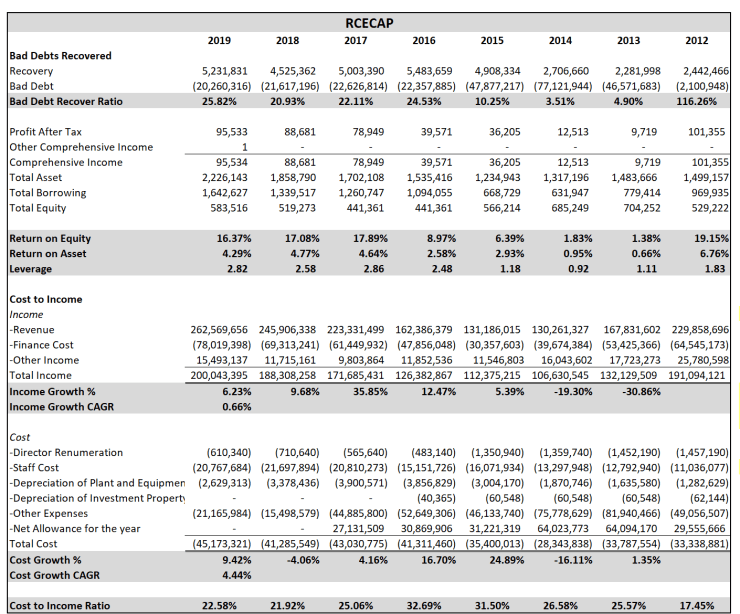
Quite like this one. As I’ve written here before.
Lets talk about RCE CAPITAL (RCECAP)
The Black Swan Hidden in RCE CAPITAL (RCECAP)
RHB Bank Berhad
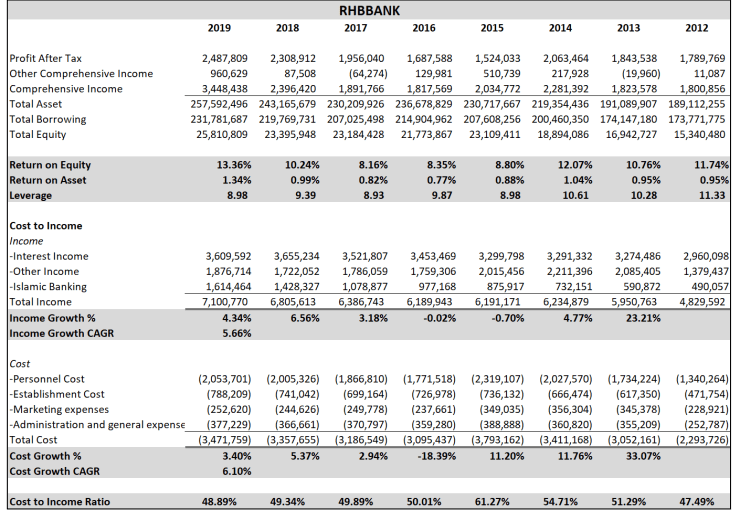
Nothing special, or particularly bad about it. Given the prices of Singaporean banks, i wouldn’t say its cheap either.
Singapore Banks
DBS Bank Ltd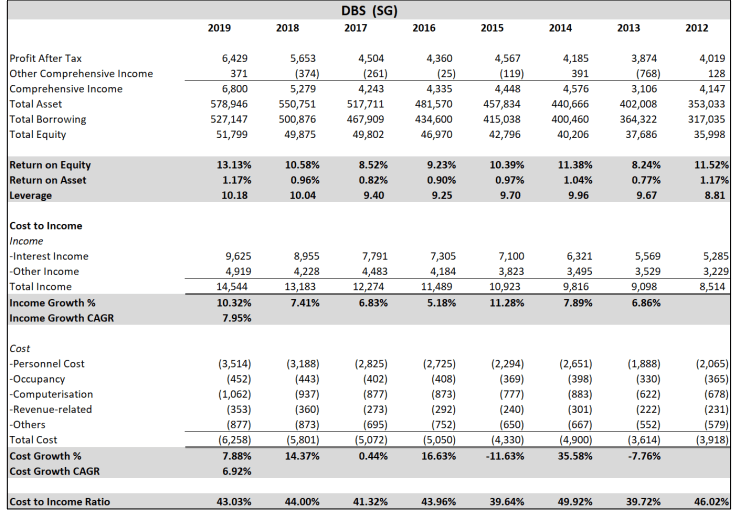
Voted best managed bank in South East Asia, numbers look very good.
ROA is thin as hell, which in retrospect, is not surprising, given that all the banks in Singapore are run by Chinaman/Chinese. So very very strong competition.
Also, its about 10PE.
Considering SGD risk free rate is sub 2%, while our’s is about 3.3%, when compared against pretty much any bank in Malaysia, its a bargain.
Worth a deeper study.
Oversea-Chinese Banking Corporation, Limited,
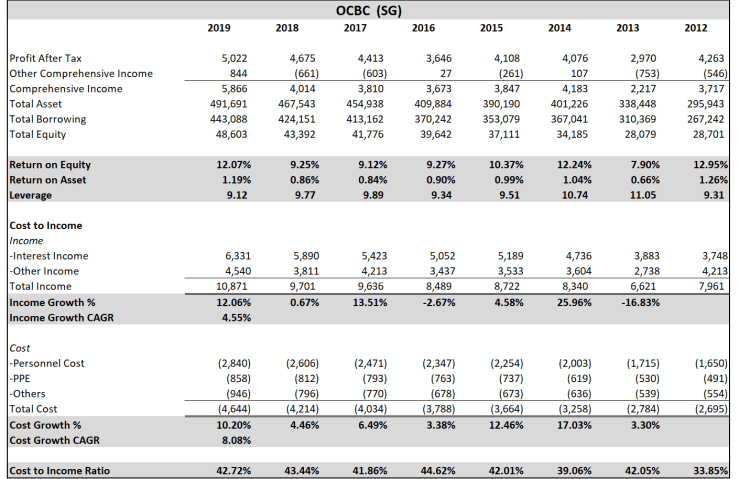
Also known as Orang China Bukan Cina Bank.
Numbers don’t look as good as DBS’s. The other 2 of the Big 3 in Sg.
Having said that, both UOB’s and OCBS’s numbers are not that far off from DBS’s.
United Overseas Bank Limited
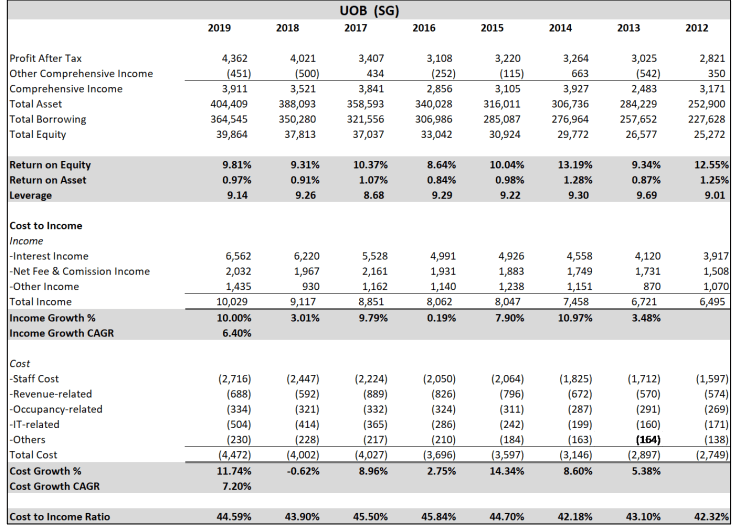
Numbers don’t look as good as DBS’s. The other 2 of the Big 3 in Sg.
Having said that, both UOB’s and OCBS’s numbers are not that far off from DBS’s.
The Real Risk
Over the last few months, they’ve been much buzz in the Malaysian Markets on how these rate cuts will decimate the earnings of the banks.
Well, in my opinion, rate cuts don’t matter as much to the earnings of the banks over the next 10 years as one would think it would. At most it will effect its earnings for the next 3-6 months, as the fixed deposits paying high rates mature. These fixed deposit rate tenures are quite short most of the time anyway, with the longest being at most one year.
There are two real danger that banks face, they are,
- Negative Interest Rates
Thankfully, we are not here yet. At least not for the foreseeable future.
The problem with negative interest rates is that, in the event that actually happens, most banks would be extremely hesitant to actually charge people money for keeping money in their bank accounts, thereby severely dropping Net Interest Margin as interest rates on borrowings fall in tandem with the now negative interest rate.
I’m not going to speak much more about this, as i’m sure many of us here have read multiple articles this by now.
- Yield Inversion
Yield inversion happens when long term interest rates actually fall below that of short term interest rates.
Now this is quite an abnormal circumstance in financial markets. Normally, short-term interest rates are below long-term interest rates, indicative of the fact that investors require more return for keeping their money tied up for longer.
But, when investors expect that a slowdown is coming, they don’t care about getting more return for keeping their money tied up. They just want to lock in yield. So, they pile into instruments with the best yields, which are long-term fixed income instruments. That flight into safe-haven assets pushes long-term bond prices up.
Alternatively, investors may be expecting that rates will fall in the short term, and in fear of not being able to renew their current bonds at similar interest rates, they then decide to buy longer dated bonds.
I won’t be elaborating much further on this as i’m sure that most here would have also read a lot on these, as its been happening everywhere around the world. But what many may not know, is that in Malaysia, the yield curve have also inverted.

The inversion was particularly severe last week, right before the rate cut, which normalized things somewhat.
Now, why is this a bad thing for banks? Its simple, banks take in short term deposits but give out mid-long term loans. If your short term deposit rate is based on the short term MGS interest rates, while your mid-long term loans is based off the lower mid-long term MGS interest rates, well, that will severely impact your profits.
Thankfully, to an extent, by and large, Malaysian Banks do not really tie their borrowing rates to mid-long term MGS, instead adopting a BLR+XX% policy.
- The Relationship Between Basel III (Banks), Solvency II (Insurance Companies) and Sovereign Debt.
Here is an interesting statistic, across the world, out of the 196 countries in the world, only around 50 or less countries run a budget surplus or balanced budget, ie the country’s revenue exceed/equal its expenses consistently.
The rest of the world runs on a deficit and needs to borrow money in order to cover the shortfall in government revenue.
And out of the 50 or less countries that balance their budgets or have surpluses, the significant economies (large enough) are,
-
- Macau
- Hong Kong
- Norway
- Singapore
- Jamaica
- South Korea
- Sweden
- Iceland
- Bulgaria
- New Zealand
- Germany
- Berlarus
- Luxembourg
- Netherlands
- Czechia
- Uzbekistan
- Switzerland
- Taiwan
Combined, these countries barely consist of 10% of global GDP. In addition, their total surpluses also does not exceed even 3% of the total deficits of the rest of the countries.
And thus the question, who are the ones borrowing money to these countries? Thus, enabling them spend far beyond their means, and allowing huge fixed costs to build up in economies around the world.
Well, allow me to introduce you to “Basel III” (New Regulation for Banks since 2009) and “Solvency II” (New Regulations for Insurance Companies since 2009).
Both of these two regulations were given rise via directives from the European Union after the 2008 Great Financial Crisis and subsequently adopted worldwide.
Banks (Basel III)
For banks, Under the new Basel III regulations, there is something called the Liquidity Coverage Ratio, which requires banks to maintain lots of very safe liquid assets like government bonds to cover funding stress.
This ratio also categorizes certain deposits as “non‐operating” and assigns them punitive haircuts when calculating the ratio.
These deposits include deposits received from the retail market. For example, fixed deposits or current accounts placed by individuals or companies.
In response to these regulations, banks are therefore incentivized to purchase and hoard sovereign debt sold by all these countries running fiscal deficits, while looking for loopholes enabling them to more profitably carry these non‐operating deposits.
These methods include:
-
- Asking customers to switch unwanted deposits into sovereign bonds the bank can hold in custody
- Asking customers to take out loans to buy sovereign bonds and replace the cash.
- Asking customers to transact through off‐balance sheet derivatives such as
swaps - Asking customers to replace physical cash positions with synthetic look‐alikes, collateralized with sovereign bonds.
All of which drives up the demand for sovereign bonds.
Insurance Companies (Solvency II)
The Insurance Companies are also under a similar situation when it comes to their Portfolio they hold and the Capital Charges/Haircuts required for each asset class in order to calculate Solvency Ratios.
Now, its probably not that easy to imagine the above scenarios, so lets put some numbers to it.
Illustrating Distortions cased by Basel III and Solvency II
Imagine a Bank/Insurance Company, lets call it “Baka-Surance Bank”.
Now, for reference, here is a sample Capital Charge/Haircut table. For simplicity sake, we assume that the Capital Charge/Haircuts are the same for both the Bank and Insurance Company.

Now, a “Standalone Charge”, is the Charge for the asset class on its own, while the “All-In Charge” includes other factors such as diversification and duration matching which should theoretically bring down risk, which is why its slightly lower.
Now one thing you will find very interesting here, is that EU Government Debt, or Sovereign Debt actually have a negative All-In Charge, which gives rise to the distortion.
To illustrate, lets use the following example. For our example, we will be using the All-In Charge figures.

Now “Baka-Surance Bank” holds a portfolio as above, and when calculating Solvency or Liquidity, its asset amounted to (“Original Asset Value” Less “Capital Charge/Haircut”), (EUR170 Billion less EUR0.8 Billion) EUR 169.2 Billion.
Now, after reviewing their portfolio, it noted that all of its “EU Government Debt 10 Years” are negative yielding. By investing money into these bonds, they are basically guaranteeing that they will lose money.
As the sovereign debt trades to a negative yield, it would be wise to sell it in order to hold cash. Selling the debt would increase liquidity, raise the portfolio’s return, lower duration risk, reduce market risk, and even reduce credit risk, as government debt can default.
Baka-Surance Bank therefore decided to sell all of it and to the “Money Market” ie, they basically chose to hold cash instead.
After the portfolio readjustment, the Portfolio now looks like this.
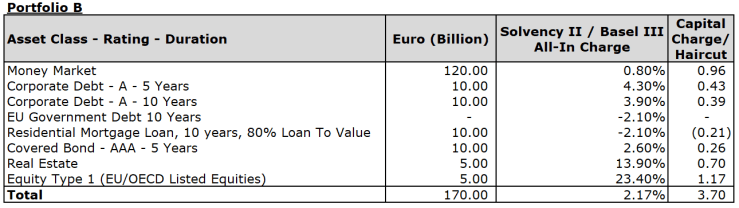
However, if they did this, the Capital Charge/Haircut is now EUR 3.7 Billion, having increased from EUR 0.8 Billion
When calculating Solvency or Liquidity, Baka-Surance Bank’s asset amounted to (“Original Asset Value” Less “Capital Charge/Haircut”), (EUR170 Billion less EUR3.7 Billion) EUR 166.3 Billion, which is now lower than when it held negative yielding sovereign debt, EUR169.2 Billion.
From this, you can see how Basel III and Solvency II practically forces Bank and Insurance Companies to hold sovereign debt.
And so, we now have the question.
As governments around the world continue to borrow money to fund ever-escalating budget deficits, and Banks/Insurance Companies are constantly incentivized to keep purchasing these Sovereign Bonds.
Given the size of the persistent deficits of these nations and the size of their hidden liabilities (17 Nobel Laurates on USD200 Trillion Deficit), which over time will inevitably result in the inability of a nation to pay its debts, and require debt forgiveness.
Well, today governments around the world are bailing out the public.
Who will bail the bailors? Where can these Government go for bailouts when its their turn?
Is it possible for the debt being so huge that it becomes impossible to bail out the country then? What happens next?
Well, these are questions so big, that i have no idea how to answer it, however, it does matter when it comes to making a decision on whether to invest in a bank.
Many of the above scenario’s, such as negative interest rates was almost always considered to be a theoretical scenario, none of the great economist we study, Keynes and Hayek etc, ever thought it could happen or last for a long time, and yet here we are, with most sovereign bonds at negative interest rates (starting with the EURO, SWISS Bonds etc since 2013).
Still, i don’t think one should rely on your conclusions (no matter how clear cut you think they) on the above two things when thinking about buying a banking stock.
There are some topics (like this one) so complex and opaque, that one needs to be highly educated and well versed in the subject, in order to be unclear about the conclusions and be unable to come to an opinion.
The conclusions to the above three scenarios will only seem clear in retrospect. At the end of the day, we need to look back to the fundamentals of the banks.
Conclusion
In any event, at current prices, other than ABMB, RCECAP and AEONCR, the rest quite frankly just don’t look that attractive to me.
I’m seriously considering PBBANK and HLBANK, but their prices needs to drop below RM15 and RM12 before it makes sense to me.
As always, do let me know what you think and if you guys have any comments.
